|
|
|
|
|
|
|
|
statistics |
|
The Statistics Module handles the production of numerous statistical analyses in the form of charts for managerial and administrative purposes. Only those with the correct rights have access to the various statistics.
|
|
|
Statistics permissions based on screen access |
|
|
All statistics go through a print preview screen |
|
|
Help per statistic |
|
|
Chart Types: bar, pie, line, dot, area |
|
|
Shows minimum, maximum, average and total |
|
|
Shows/hides horizontal and vertical lines |
|
|
Shows the graph in 2D or 3D |
|
|
Shows/hides values |
|
|
Shows graph background as transparent, semi-transparent or opaques |
|
Statistics 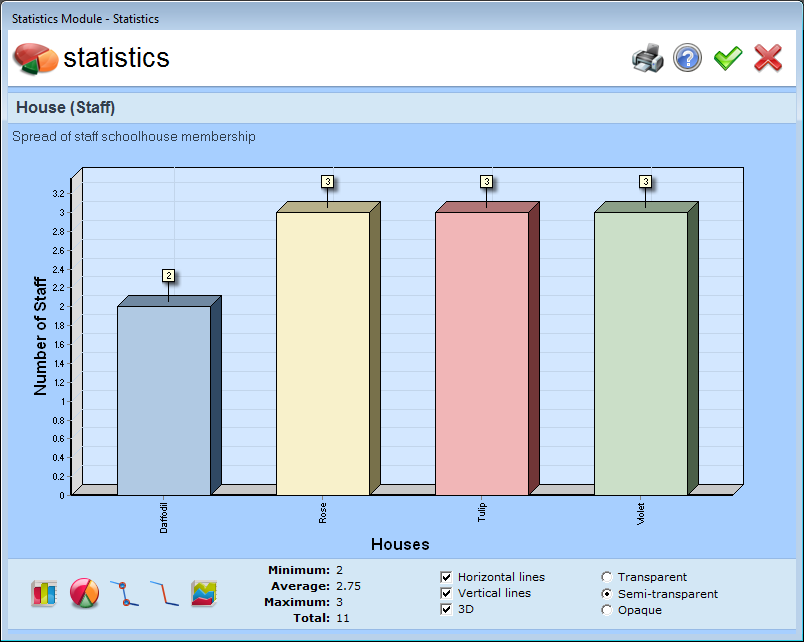
|
|
The display of statistics can be found in certain areas of TS School
|
|
Reports 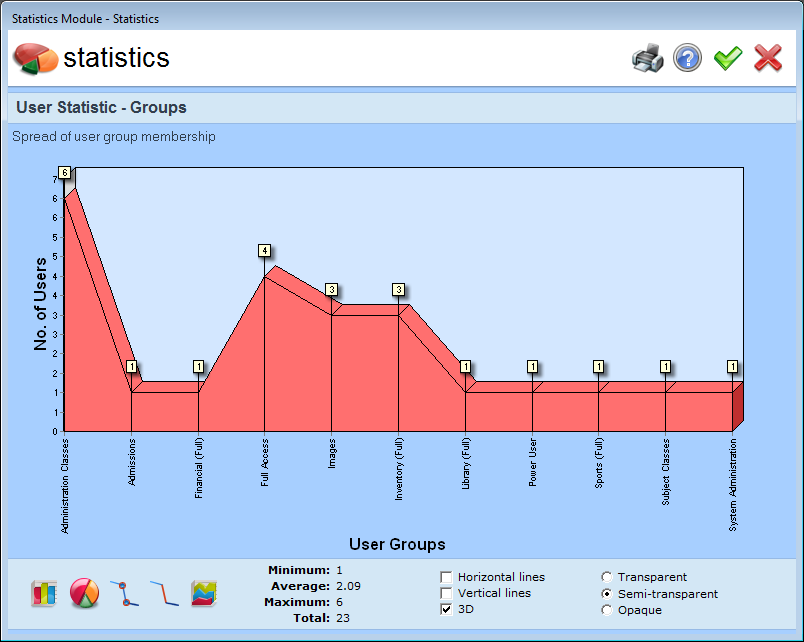
|
|
The statistics module contains 30 statistics reports. Charts can be found in both student and staff modules which contribute to the display of valuable information.
|
|
Print charts 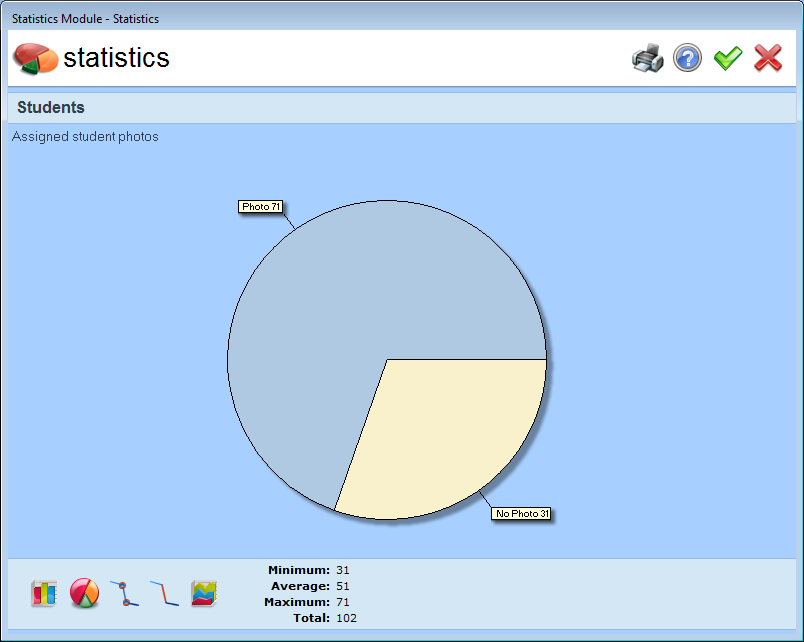
|
|
Charts may be printed from the statistics module by clicking on the print button at the top of the window.
|
|
|
+27 (0) 63 327 4560 | |
© Copyright 1993 - 2025 Time Software
|
||